A call to RSR in the formula for a state process adds an autocorrelated
spatial random effect to the model in the form of a Restricted Spatial
Regression (RSR). For examples of RSRs applied to ecological data, see
Johnson et al. (2013) and Broms et al. (2014).
The function can also be used outside a formula to visualize the spatial
relationships between sites in your data and choose an appropriate
distance threshold below which two sites will be considered neighbors, and
thus potentially correlated, for the RSR model. For more details, see the example vignette:
vignette("spatial-models", package = "ubms")
RSR(x, y = NULL, threshold, moran_cut = NULL, plot_site = NULL)Arguments
- x
A vector of coordinates (should be projected)
- y
An (optional) second vector of coordinates
- threshold
The distance cutoff below which two sites will be considered neighbors. Should be the same units as the coordinates.
- moran_cut
The number of eigenvectors to use in the RSR. The possible range of values is between 1 and the number of sites. Smaller numbers will result in faster runtime and smoother map output, and vice-versa. If not provided (the default), the number of eigenvectors will be set as 10% of the number of sites which is usually appropriate.
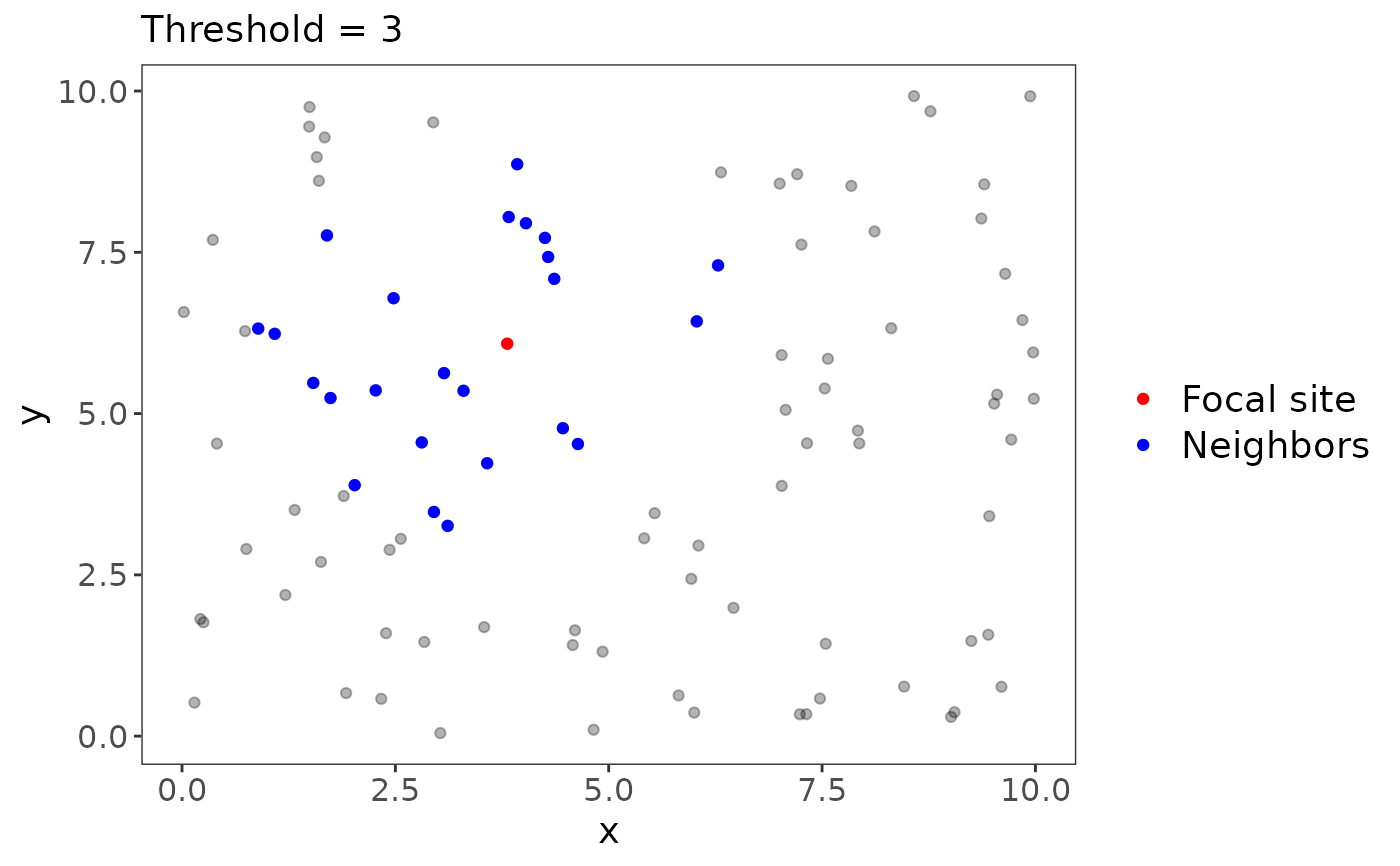
- plot_site
If a site number (as an integer) is supplied, the function returns a plot showing that site and its neighbors under the current settings. Useful for deciding what to set your threshold at.
Value
Either a list of spatial matrices used for the RSR (only useful
internally to ubms), or if plot_site is an integer, a ggplot object.
References
Broms KM, Johnson DS, Altwegg R, Conquest LL. 2014. Spatial occupancy models applied to atlas data show Southern Ground Hornbills strongly depend on protected areas. Ecological Applications 24: 363-374.
Johnson DS, Conn PB, Hooten MB, Ray JC, Pond BA. 2013. Spatial occupancy models for large data sets. Ecology 94: 801-808.